Population needs assessment
The foundation of effective strategic commissioning is a picture of the local community and its health and wellbeing needs.
Joint strategic needs assessment
The Local Government and Public Involvement in Health Act 2007 placed a duty on health and local authorities to jointly deliver Joint Strategic Needs Assessments (JSNA). Following the 2010 White Paper ‘Equity and excellence: liberating the NHS’, local authorities now lead the development of JSNAs, working with CCGs and other agencies.
The White Paper sets out how CCGs will have ‘a duty to promote equalities and to work in partnership with local authorities, for instance in relation to health and adult social care, early years services, public health, safeguarding, and the wellbeing of local populations’. Click here for further information about joint strategic needs assessment.
The NHS Information Centre for health and social care (NHSIC) provides a range of data and indicators from the Joint Strategic Needs Assessment (JSNA) core data set. It classifies data via a central portal and under the following domains; Demography, Social and Environmental Context, Life Style and Risk Factors, Burden of ill-health and Services.
While the JSNA is the overarching document in adult health and social care, each sector may have more detailed needs assessments which inform the individual sector commissioning strategies. Co-ordination of strategy development is important for all stakeholders, including individuals and local communities and the process of development and co-ordination needs to be intelligible to those involved.
Population needs methodology
The Department of Health's guidance on JSNA defined needs assessment as:
"A systematic method for reviewing the health and wellbeing needs of a population, leading to agreed commissioning priorities that will improve health and wellbeing outcomes and reduce inequalities."
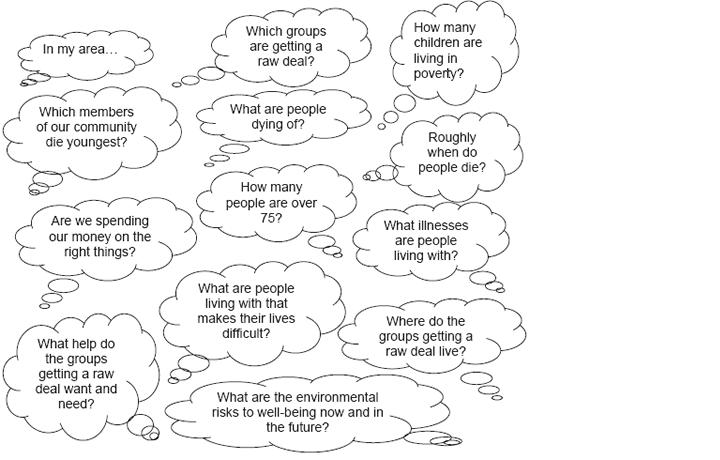
Needs assessment examines aggregated assessment of population need. Specifically, it is a tool to identify groups where needs are not being met and that are experiencing poor outcomes. It should help to answer the following questions:
A population needs assessment can help commissioners to forecast demand based on the assumption that the presence of certain characteristics or conditions is an indicator of future demand for services. It can also help to identify health inequalities and specific at risk populations. Population needs assessment usually consists of four elements:
- Demographic data, i.e. a profile of the current baseline population and projections of how that population is likely to change over time;
- Prevalence and incidence data to estimate the size of the target population, its demographic profile and the type and severity of need;
- Risk factor data to identify the likelihood of people requiring health and wellbeing services;
- Patient/service user data about the people who actually use services, their needs and voice as well as public demands.
Demographic data will allow commissioners to understand the characteristics of their population in terms of age, life expectancy, gender, ethnicity and location. Population projections are an important data source in estimating future need and placing that need within the context of general population change. They show what the population will be if recent trends continue, where vulnerable people are likely to live, and for how long.
The table below summarises the sorts of demographic data that would form the basis of a needs assessment, together with a list of suggested sources and examples of the types of questions that might be considered.
Demographic data for needs assessment
| Demographic Data Required | Data sources | Target Population | Questions to Consider |
|---|---|---|---|
| Current numbers of people, disaggregated by district / locality / ward | 2011 Census, ONS | All | In which areas are the target population most concentrated? |
| Projected numbers of people | Sub-National Population Projections, ONS | All | Which age groups have the least / greatest projected growth and over what period? What is the current and projected birth rate? |
| Age Range | 2011 Census | Older people | Which localities / wards have the greatest concentration of older people? Which localities / wards have the greatest number of people aged 85 and over? |
| Life expectancy | ONS Life Tables, Government Actuarial Department Ageing: Scientific Aspects, House of Lords, 2005 |
Older people | What is life expectancy of people currently aged 65 / 75 etc? What is the difference between life expectancy at 65 / 75 etc and healthy life expectancy? |
| Gender | 2011 Census, ONS | All | In which age groups are there significant gender imbalances? |
| Ethnicity | 2011 Census, ONS Policy Research Institute on Ageing & Ethnicity |
All | In which wards / localities do ethnic minorities live? What are their characteristics in terms of age / gender? What are the particular health problems of black and minority ethnic elders? |
Prevalence and incidence rates can be applied to the demographic data to estimate the size of the target population and the type and severity of future need e.g. the prevalence of dementia, or the incidence of strokes in older people. A table showing useful sources of prevalence and incidence data for needs assessment and examples of the types of questions that might be considered for adult services can be downloaded.
It is also important to identify risk factors that may lead members of the target population to require health and wellbeing services. These risk factors are identified through research e.g. research indicates that deprivation is a risk factor for substance misuse but not for severe learning difficulties. Similarly, research indicates that gender is a risk factor for suicide but not for dementia. A table of the risk factors for needs assessment identified through research for different target populations and examples of the types of questions that might be considered for adult services can be downloaded.
Finally, it is useful to profile existing service users in terms of age, gender, ethnicity and location, and compare this to the sort of profile that would be expected from an analysis of demographic, prevalence, incidence and risk data e.g. for clients receiving community based services or for admissions to hospital. Are the people who currently use services the people we would expect? Are there any particular groups missing or overrepresented? It is also essential to complement statistical data by more detailed qualitative information about need from patients/service users or the public via surveys, interviews, focus groups, complaints, petitions, or reviews of existing research.
Further details about this methodology can be found in The Role of Needs Analysis in Developing a Commissioning Strategy by the Institute of Public Care.
Projecting older people population information (POPPI) and Projecting adult needs and service information (PANSI)
The Institute of Public Care provides two online planning systems for England:
- Projecting Older People Population Information (POPPI), for data about people aged 65+.
- Projecting Adult Needs and Service Information (PANSI), for data about people aged 18-64.
Both systems display the latest ONS population projections by gender and age band, for England, the Regions, Councils and council districts. Latest ethnicity data is also provided. Data can be downloaded into spreadsheets.
National prevalence information from published research and surveys that are likely to affect the needs of the population are applied to the data, including conditions such as learning disabilities, mental health problems, dementia, heart attack, stroke, bronchitis/emphysema, falls - A&E attendance and hospital admissions. Some census data is also included.
POPPI and PANSI bring together relevant information for commissioners and provide a consistent starting point for Joint Strategic Needs Assessment.